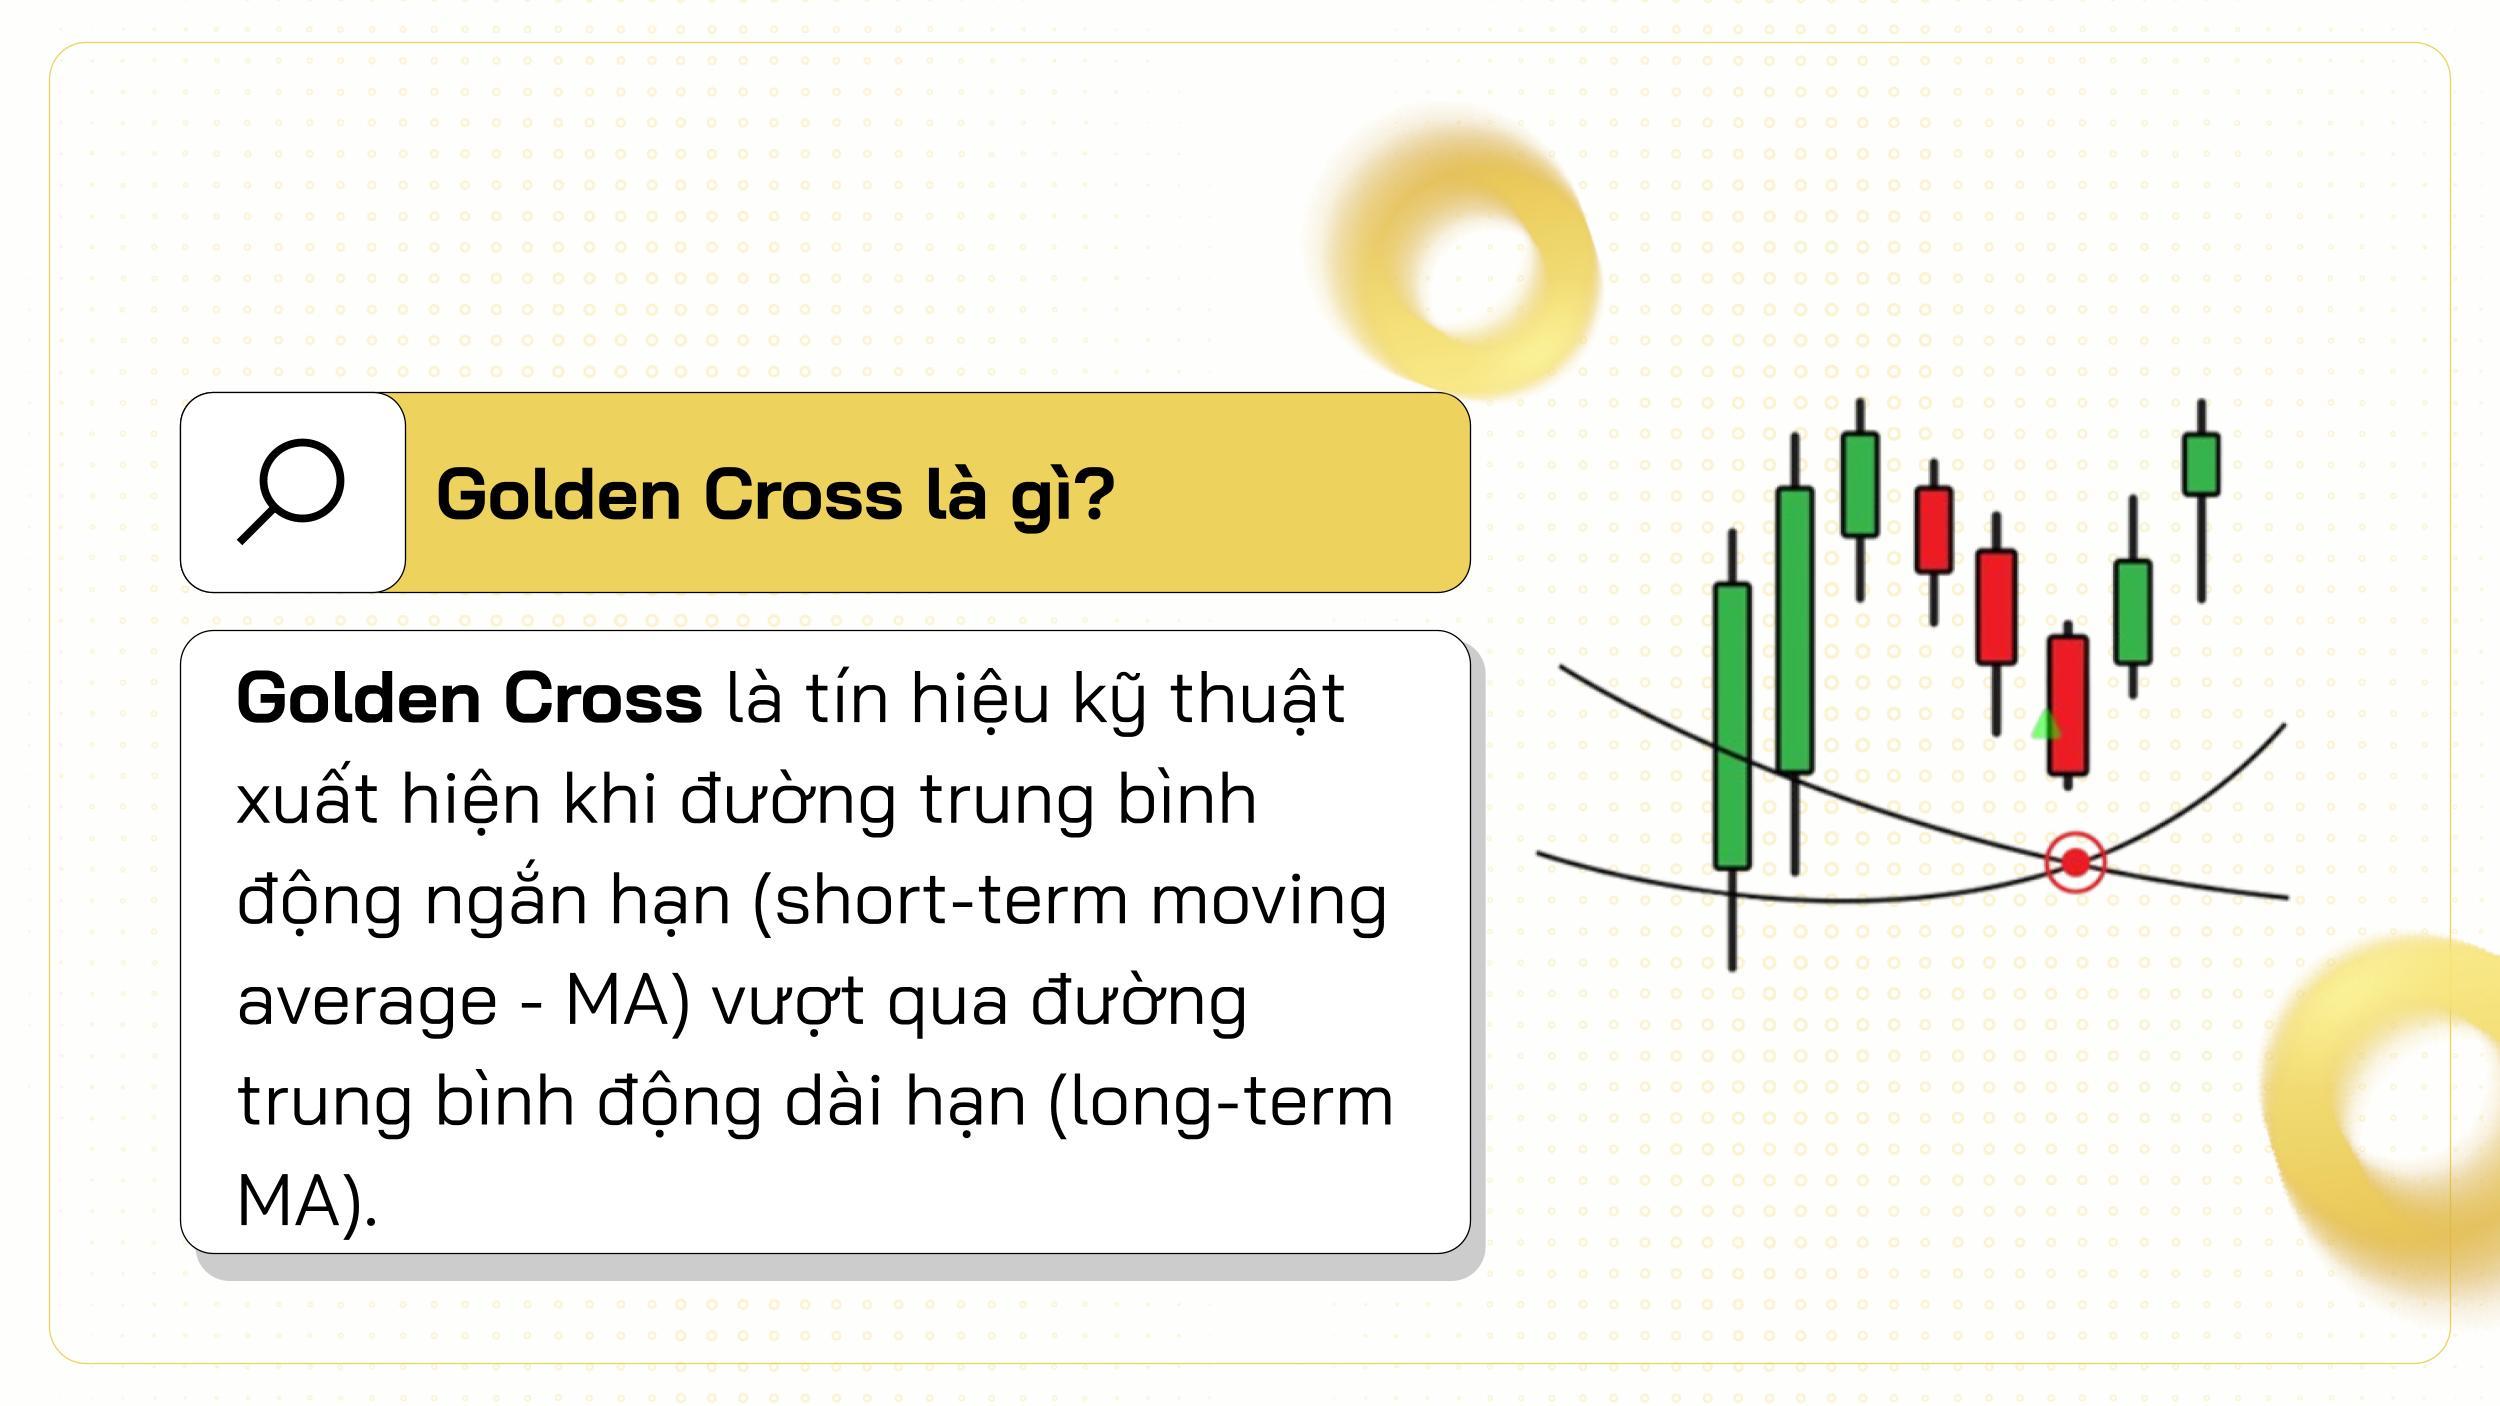
The Golden Cross is a technical indicator that occurs when a short-term moving average (MA) crosses above a long-term MA. Typically, the 50-day MA (MA50) is used as the short-term average and the 200-day MA (MA200) as the long-term average. This crossover is generally considered a bullish signal, suggesting a potential shift from a bearish to a bullish trend, often signifying the beginning of a significant price rally.
Table Content:
- How the Golden Cross Works in Cryptocurrency
- Accumulation Phase: The Calm Before the Storm
- Crossover Point: The Bullish Signal
- Bullish Trend: Riding the Wave
- Historical Golden Cross Examples
- Utilizing the Golden Cross: A Practical Guide
- Chart Analysis Tools
- Confirmation with Other Indicators
- Entry Point Determination
- Risk Management
- Limitations of the Golden Cross
 Illustrative Chart of the Golden Cross
Conversely, the Death Cross, a bearish indicator, occurs when the MA50 crosses below the MA200, suggesting a potential downtrend. For example, Bitcoin formed a Death Cross in June 2022 as its price declined from $30,000 to $16,000 over five months.
 Comparison of Golden Cross and Death Cross
How the Golden Cross Works in Cryptocurrency
The formation of a Golden Cross typically unfolds in three phases:
Accumulation Phase: The Calm Before the Storm
This initial phase is characterized by declining or sideways price action over an extended period. The market consolidates, and the MA50 begins to converge with the MA200. This suggests a potential shift from bearish to bullish sentiment. Key characteristics include: minimal price fluctuations, cautious investor sentiment with low trading volume, and the MA50 gradually approaching but remaining below the MA200. Bitcoin’s price hovering around $30,000 in June and July 2021, with low trading volume, exemplified this phase before the Golden Cross formation in July.
Crossover Point: The Bullish Signal
This crucial point occurs when the MA50 crosses above the MA200, signaling increased buying pressure and a potential uptrend. This is often a good time for investors to consider entering long positions, especially when confirmed by other indicators like the Relative Strength Index (RSI) or Moving Average Convergence Divergence (MACD). Key characteristics include: slight price increases with potential short-term breakouts, significantly increased trading volume reflecting growing investor interest, and the MA50 decisively crossing above the MA200. Bitcoin’s Golden Cross on July 14, 2021, saw its price surge from $30,000 to over $69,000 by November 2021.
Bullish Trend: Riding the Wave
Following the Golden Cross, prices often continue to rise, establishing a strong uptrend. Investors typically hold their assets, capitalizing on the momentum. However, minor corrections can occur before further upward movement. Key characteristics include: consecutive new highs breaking key resistance levels, sustained high trading volume, and the MA50 remaining significantly above the MA200. Bitcoin’s post-July 2021 Golden Cross performance, reaching $69,000 in November 2021, illustrates this phase.
 Detailed view of MA50 crossing MA200
These phases highlight a potential bull market cycle. Identifying them can help optimize investment strategies, from preparation and timely entry to holding during the growth phase. However, confirming signals with indicators like RSI, MACD, and trading volume is crucial for effective risk management.
Historical Golden Cross Examples
Bitcoin (BTC): A Golden Cross formed on February 20, 2020, with the MA50 crossing above the MA200. BTC’s price rose from $9,500 to over $12,000 within two months, preceding a sustained rally to over $60,000 in 2021.
Ethereum (ETH): In August 2021, Ethereum experienced a Golden Cross around $2,700. ETH’s price subsequently surged, reaching a peak of $4,800 by November 2021.
Utilizing the Golden Cross: A Practical Guide
Chart Analysis Tools
Utilize platforms like TradingView or Binance to analyze charts, add MA indicators (MA50 and MA200), and observe crossovers. Focus on longer timeframes like daily (D1) or weekly (W1) charts for identifying long-term trends.
Confirmation with Other Indicators
Combine the Golden Cross with other indicators like RSI, MACD, and trading volume for confirmation. Look for RSI within the 30-70 range, MACD crossing above its signal line, and high trading volume accompanying the Golden Cross.
Entry Point Determination
While the crossover is a potential buy signal, confirm with other indicators and observe price breaking key resistance levels. Consider Dollar-Cost Averaging (DCA) to mitigate risk.
Risk Management
Set profit targets and use stop-loss orders to protect capital. Continuously evaluate your strategy’s effectiveness.
Limitations of the Golden Cross
The Golden Cross is not infallible. It can lag behind price action, provide false signals in sideways markets, and is unsuitable for short-term trading. Crypto markets are volatile and susceptible to unforeseen events. Always combine the Golden Cross with other indicators and practice prudent risk management.


